CRE AI NEWS
Manhattan’s Office Squeeze Is Measured. Its AI Story Is Not.
Colliers reported on September 1 that Manhattan office availability fell to 65.40 million square feet in August, the lowest since September 2020, with the availability rate at 12.5 percent and sublet supply at its lowest since 2019. Year to date leasing of 29.91 million square feet puts 2026 on pace for the strongest year since 2000. Colliers does not attribute any of it to AI.
Direct answer
Direct answer to Manhattan office availability August 2026
Manhattan’s prime office scarcity is primary-verified and the AI attribution behind it is not. Colliers measures the supply, the rate and the rents, and never mentions artificial intelligence. The claim that AI tenants are driving the squeeze comes from brokers quoted in trade press and from a JLL report behind a lead capture form. Underwrite the tightening you can source, and treat the tenant mix as the assumption it currently is.

What Colliers reported on September 1
Colliers published its Manhattan office market report for August 2026 on September 1. Leasing activity totaled 3.25 million square feet in August, down 16.0 percent from July and still above both the five year and the ten year monthly averages. Year to date volume reached 29.91 million square feet, up 9.4 percent from the same period in 2025, which Colliers says puts 2026 on pace for the strongest annual leasing total since 2000 if the current pace continues. The availability rate fell by 0.2 percentage points to 12.5 percent as total availability declined to 65.40 million square feet, the lowest level since September 2020 and, in Colliers’ own framing, one third below the post-pandemic peak reached in February 2024. The market recorded 0.83 million square feet of positive absorption during the month.
Two other figures in the same report matter more to a landlord than the headline does. Sublet availability was cut by 40,000 square feet in August and fell 22.3 percent over the past year to 10.07 million square feet, the lowest sublet supply since August 2019. Sublet space is the shadow inventory that capped Manhattan pricing for four years, and it now sits at roughly 15 percent of all available space, which computes from the two figures Colliers printed in the same report. The overall average asking rent decreased by 0.2 percent since July but grew 4.2 percent since August 2025. Colliers’ second quarter report, published July 8, carries the level behind that rate of change: the Manhattan asking rent average rose 0.6 percent in the second quarter to $78.03 per square foot, the highest since July 2020, up 5.7 percent over twelve months, and 1.8 percent below the March 2020 average of $79.47.
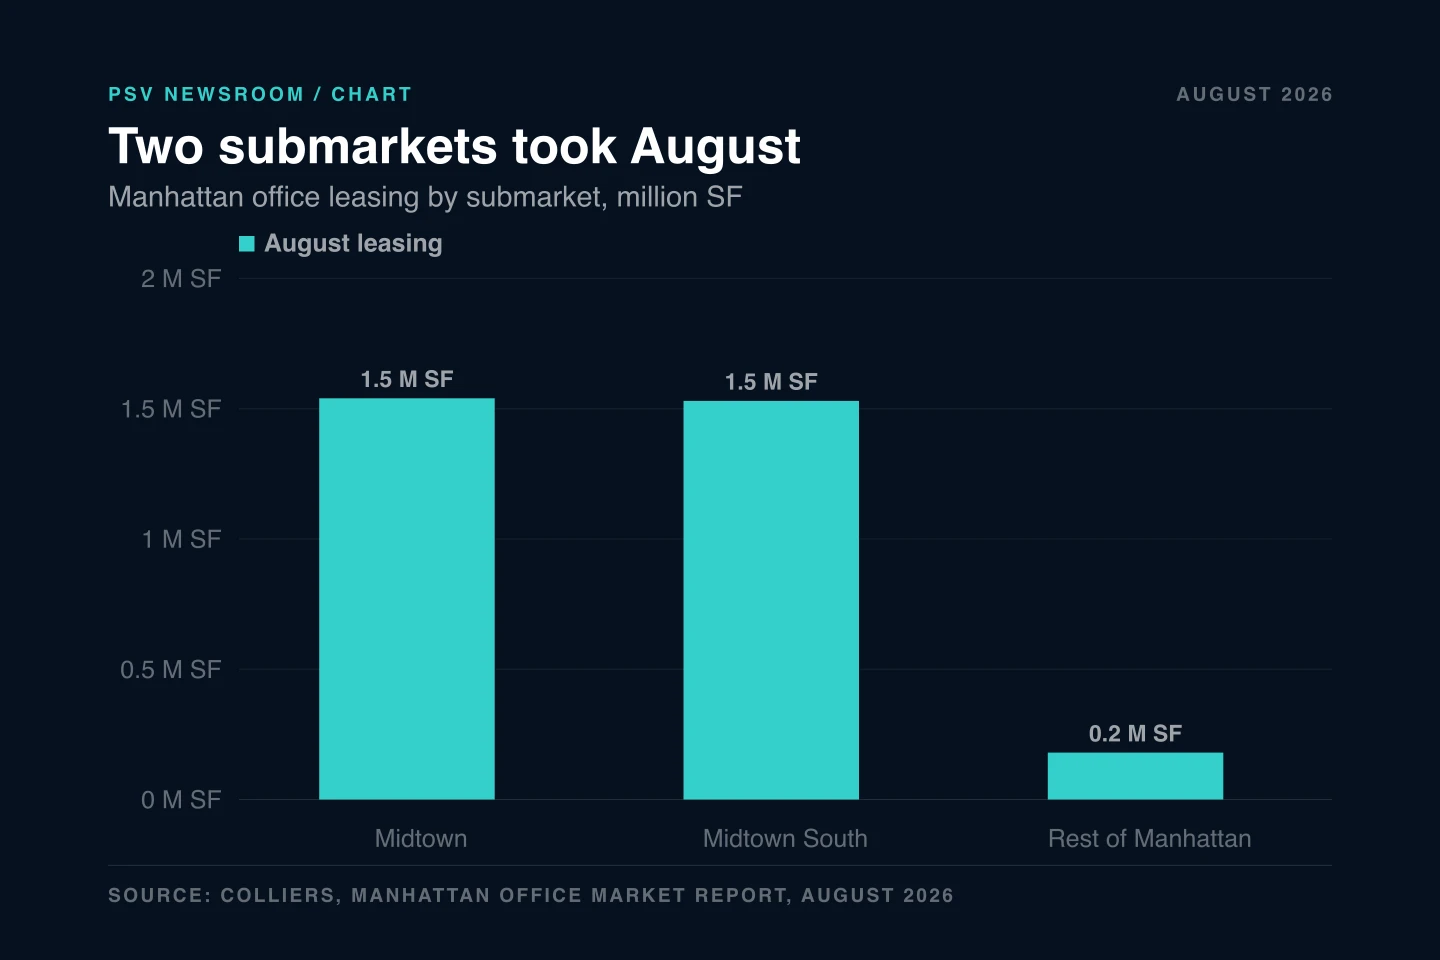
The concentration is the part a leasing team should read twice. Midtown leasing rose to 1.54 million square feet, led by General Atlantic’s 152,000 square foot transaction at 625 Madison Avenue and KeyBank’s 113,000 square foot renewal and expansion at 1301 Avenue of the Americas. Midtown South contributed another 1.53 million square feet, supported by commitments from Havas Health Network and the City of New York, and Colliers records both submarkets decreasing their availability during the month. Those two submarkets sum to 3.07 million square feet, which computes to about 94 percent of the month’s 3.25 million and leaves roughly 0.18 million square feet for the rest of Manhattan. Midtown South alone computes to about 47 percent. That arithmetic is PSV’s, done on figures Colliers published in one report, not a share Colliers stated.
The tightening is not a single month. Colliers’ second quarter report records the availability rate cut by 0.7 percentage points since March 2026 to 13.0 percent, the ninth straight quarter of a tightening or stable availability rate and the longest such run since 2007. Quarterly leasing of 11.02 million square feet ran 29.4 percent above the five year quarterly average, and Colliers notes it was the first time since 2002 that demand exceeded 11.00 million square feet for three consecutive quarters. Available supply stood at 68.10 million square feet in June, which Colliers put 30.5 percent below the February 2024 post-pandemic peak. The two reports can be checked against each other: 68.10 million at 30.5 percent below the peak implies a February 2024 peak of about 98.0 million square feet, and 65.40 million measured against that implied peak computes to almost exactly the one third decline the August report claims. The two records agree, which is worth knowing before either is quoted alone.
The scarcity is measured. The AI attribution is not.
Neither Colliers report mentions artificial intelligence. Not once. They measure supply, absorption, leasing volume and asking rents, and they name the tenants behind the largest August commitments: a private equity firm, a bank, a healthcare marketing network and the City of New York. None of those is an AI company. That is worth stating plainly, because the same week’s trade coverage attributed Manhattan’s squeeze substantially to AI demand, and an operator reading both in the same sitting could easily merge two records that do not say the same thing.
The AI claim comes from two places, and neither is a primary record PSV could open. Commercial Observer reported on September 8 that high quality Manhattan space is now drawing competing bids, citing named brokers at JLL, Newmark, Koeppel Rosen and Current Real Estate Advisors, and describing landlords raising asking rents in the middle of marketing a space: a 17,610 square foot availability at 151 West 26th Street moving from $56 to a range of $60 to $70 per square foot, and a 3,612 square foot space at 1261 Broadway climbing from $44 to $53. It quotes a Koeppel Rosen leasing director describing AI tenants that take 15,000 square feet today and need 30,000 a year later. Separately, Connect CRE reported on September 4 that a new JLL report puts technology as the city’s second most active leasing sector behind finance, with finance, law and technology together above 70 percent of year to date leasing against roughly 50 percent through the 2010s, and tech leasing of 1.1 million square feet in the quarter with AI companies behind more than 60 percent of it. PSV did not verify those JLL figures. JLL’s New York Office Market Dynamics report sits behind a lead capture form, and PSV does not submit contact details to obtain a source, so they are reported here as reported.
The one public primary record on AI office leasing volume is CBRE’s, and it is older and narrower than the way it usually gets quoted. In a May 12, 2026 release CBRE reported that AI companies leased 21 million square feet in San Francisco and Silicon Valley since 2019, and another 9.4 million square feet in Manhattan, Boston and Seattle over the same period. That 9.4 million is a three market total across seven years, not a Manhattan figure and not a 2026 figure, and it is routinely repeated as though it were both. CBRE separately put tech at 22.7 percent of all United States office leasing in the first quarter of 2026 and 16.8 percent for full year 2025, and attributed the shift to $578 billion of venture capital into United States AI companies since 2020, roughly 80 percent of it in the Bay Area. CBRE Tech Insights Center executive director Colin Yasukochi said AI investment “has moved from research and experimentation to large-scale deployment.” That is CBRE describing its own data, and it is a national read rather than a Manhattan month.
So the honest state of the record is this. The tightening is measured, dated and public, and it has been running for nine quarters. The composition of the demand causing it is reported by brokers with a commercial interest in the market they are describing, and by a report PSV could not open. Both can be true at once. An operator who underwrites the first is standing on a published series; an operator who underwrites the second is standing on an attribution. PSV covered the national version of this question on August 20 reading CBRE’s Scoring Tech Talent 2026, and the gap has not closed since: nobody has published square feet per AI worker, and nobody has published what share of Manhattan’s 29.91 million square feet of 2026 leasing went to AI tenants.
The workflow PSV would run
The job here is not forecasting. It is keeping two kinds of record apart inside one table, so a leasing or acquisitions team stops merging them by accident. Inputs: the Colliers Manhattan monthly and quarterly reports for the trailing eight quarters, captured as published figures with their publication dates attached; the portfolio’s own availability and asking rent history by building and by floor; every executed comparable in the relevant submarket with tenant name, square footage, term and stated industry; and each tenant’s own public record, meaning press releases, funding announcements, filings and posted job listings. Output: one table, one row per comparable, carrying square footage, submarket, asking rent at listing, rent at signing, the delta between them, the tenant’s industry as the tenant describes itself, and a source link with a date in every populated cell.
The column that does the real work is the last one, which labels every figure as measured, reported or inferred. Nothing moves between those three states without a citation changing. A model is genuinely good at the retrieval and normalization here: reading twenty market reports, pulling the same six fields out of each, matching tenant names against the tenants’ own public descriptions of themselves, and flagging every row where a broker’s industry label and the tenant’s self-description disagree. A model is not the thing that decides whether a given tenant counts as an AI company, and that classification is exactly where this analysis goes wrong, because “tech tenant” and “AI tenant” are doing different work in different reports and neither term carries a published definition. The arithmetic stays in the spreadsheet rather than in the model, because a model asked to roll up rent deltas across forty comparables will return a plausible number and no audit trail. The leasing lead reviews every row where the industry label is contested, and the head of leasing signs the version that reaches an investment committee. Refresh it when Colliers publishes, which is monthly. PSV has not run this build for a client and claims no result from it.
What stays human, and what is still unknown
The operator read
Finish with the judgment call.
The reported facts are above. Enter your email for PSV's operator conclusion and a year of access to every newsroom brief.
Free. No card. Privacy policy. Unsubscribe anytime.
 by PSVLive
Build the workflow behind this analysis. Train with the operators doing it.
Real deal files, live builds, and production-ready CRE AI workflows inside the CRE AI Institute.











Clear answers
Common questions about Manhattan office availability August 2026
How tight is the Manhattan office market in 2026?
Tighter than at any point since 2020 on Colliers’ measure, and tightening for nine straight quarters. In its Manhattan office market report for August 2026, published September 1, Colliers put total availability at 65.40 million square feet, the lowest level since September 2020 and one third below the post-pandemic peak reached in February 2024, with the availability rate down 0.2 percentage points in the month to 12.5 percent and 0.83 million square feet of positive absorption. Leasing activity totaled 3.25 million square feet in August, down 16.0 percent from July but above both the five year and ten year monthly averages, bringing year to date volume to 29.91 million square feet, up 9.4 percent year over year and on pace for the strongest annual total since 2000 if the pace continues. Colliers’ second quarter report, published July 8, adds the trend: the availability rate fell 0.7 percentage points from March to 13.0 percent in June, the ninth consecutive quarter of a tightening or stable rate and the longest such run since 2007, and quarterly leasing of 11.02 million square feet ran 29.4 percent above the five year quarterly average. The single figure most likely to move renewal pricing is sublet supply, which Colliers has down 22.3 percent over the year to 10.07 million square feet, the lowest since August 2019.
Are AI companies driving Manhattan office leasing?
It is widely reported and it is not established by any primary record PSV could open, and the distinction matters if you are underwriting off it. Neither of Colliers’ Manhattan reports mentions artificial intelligence at all: the tenants they name behind the largest August commitments are General Atlantic, KeyBank, Havas Health Network and the City of New York, none of them AI companies. The AI attribution comes from two secondary places. Commercial Observer reported on September 8, 2026 that prime space is drawing competing bids, quoting named brokers and describing asking rents re-cut during marketing, including a 17,610 square foot availability at 151 West 26th Street moving from $56 to a range of $60 to $70 per square foot. Connect CRE reported on September 4, 2026 that a JLL report puts technology as the city’s second most active leasing sector behind finance, with finance, law and tech above 70 percent of year to date leasing and AI companies behind more than 60 percent of quarterly tech leasing; that JLL report sits behind a lead capture form and PSV did not verify its figures. The one public primary record is CBRE’s May 12, 2026 release, which reports that AI companies leased 9.4 million square feet in Manhattan, Boston and Seattle combined since 2019, a three market seven year total that is frequently misquoted as a Manhattan figure. No public source breaks Manhattan’s 2026 leasing volume down by tenant industry.
Which Manhattan submarkets are actually tightening?
Midtown and Midtown South, to a degree that makes Manhattan-wide figures misleading. Colliers reports Midtown leasing of 1.54 million square feet in August 2026, led by General Atlantic’s 152,000 square foot transaction at 625 Madison Avenue and KeyBank’s 113,000 square foot renewal and expansion at 1301 Avenue of the Americas, and Midtown South leasing of 1.53 million square feet supported by commitments from Havas Health Network and the City of New York, with both submarkets recording availability decreases during the month. Those two sum to 3.07 million square feet against a 3.25 million square foot month, which computes to about 94 percent of August leasing and leaves roughly 0.18 million square feet for the rest of Manhattan; Midtown South alone computes to about 47 percent. That arithmetic is PSV’s, performed on figures Colliers published in a single report rather than shares Colliers stated. The practical consequence is that a supply decision, a renewal strategy or an acquisition underwritten against “the Manhattan office recovery” is in most cases being underwritten against two submarkets, and the rest of the borough is absorbing very little. On pricing, Colliers has the Manhattan asking rent average at $78.03 per square foot in the second quarter, the highest since July 2020 and 1.8 percent below the March 2020 average of $79.47, with August asking rents down 0.2 percent from July and up 4.2 percent year over year. Asking rent is a landlord’s number, and neither report publishes the spread to taking rent.
Primary source record
These records support the reported facts in this brief. PSV’s CRE workflow interpretation and test plan are original analysis.
- Colliers, Manhattan Office Market Report, August 2026 (published September 1, 2026)
- Colliers, Manhattan Office Market Report, Q2 2026 (published July 8, 2026)
- CBRE, AI Investment Fuels Office Leasing Recovery Across Major Markets (May 12, 2026)
- Wikimedia Commons: Midtown Manhattan skyline from the One World Observatory, by Christian David, CC BY-SA 4.0 (source of the lead photograph)
Topics
Related PSV analysis
CRE AI NEWS
AI Is Leasing Offices and Cutting the Jobs That Fill Them
CBRE published its Scoring Tech Talent 2026 report on August 18. AI-skilled tech talent across the U.S. and Canada grew 45 percent year over year to 751,000, and AI roles now account for 31 percent of open U.S. tech talent jobs, 57 percent in the San Francisco Bay Area. The same report records 101,743 job cuts this year that employers attributed directly to AI.
CRE CAREERS
Will Claude Replace Junior CRE Analysts? Read the Hiring Data First
Most junior analyst work is repeatable: pull comps, update the model, abstract the leases, research the market and the sponsor, build the IC deck, prepare the lender update. A senior professional working with Claude can now do much of that directly, sometimes faster than the analyst would have. So why keep hiring juniors? The payroll research shows entry-level hiring already contracting in AI-exposed work. It also shows precisely where it is not contracting, and that second finding is the entire answer.
CRE AI NEWS
AI Searched 200 Title Files. The Misses Clustered in One Place.
DataTrace released a study on July 29 comparing public-record-only AI title search against search supported by its own title plant data. Across 200 residential title files, the AI search missed at least one meaningful matter in 40.8 percent of searchable files, and could not search 16 of the files at all. The company sells the title plant data it benchmarked against.
Related guides
Cornerstone PSV guides on the workflows in this article.
Office Real Estate AI Underwriting & Acquisitions
Custom AI employees for office real estate underwriting. Distress sourcing, TI/LC modeling, conversion feasibility, and tenant rollover analysis.
Read the guideWhat is CRE AI?
The definitional guide to commercial real estate AI: the core workflows, how it differs from a chatbot, and how to learn it.
Read the guideby PSVLiveYou read the operator view. Now learn to run the workflow.
The AI MBA for commercial real estate: the workflows these briefs describe, taught end to end on real deal files, with live builds and a community of CRE operators.