CRE AI NEWS
NAR’s Data Center Report: The Commercial Finding Was the Clear One
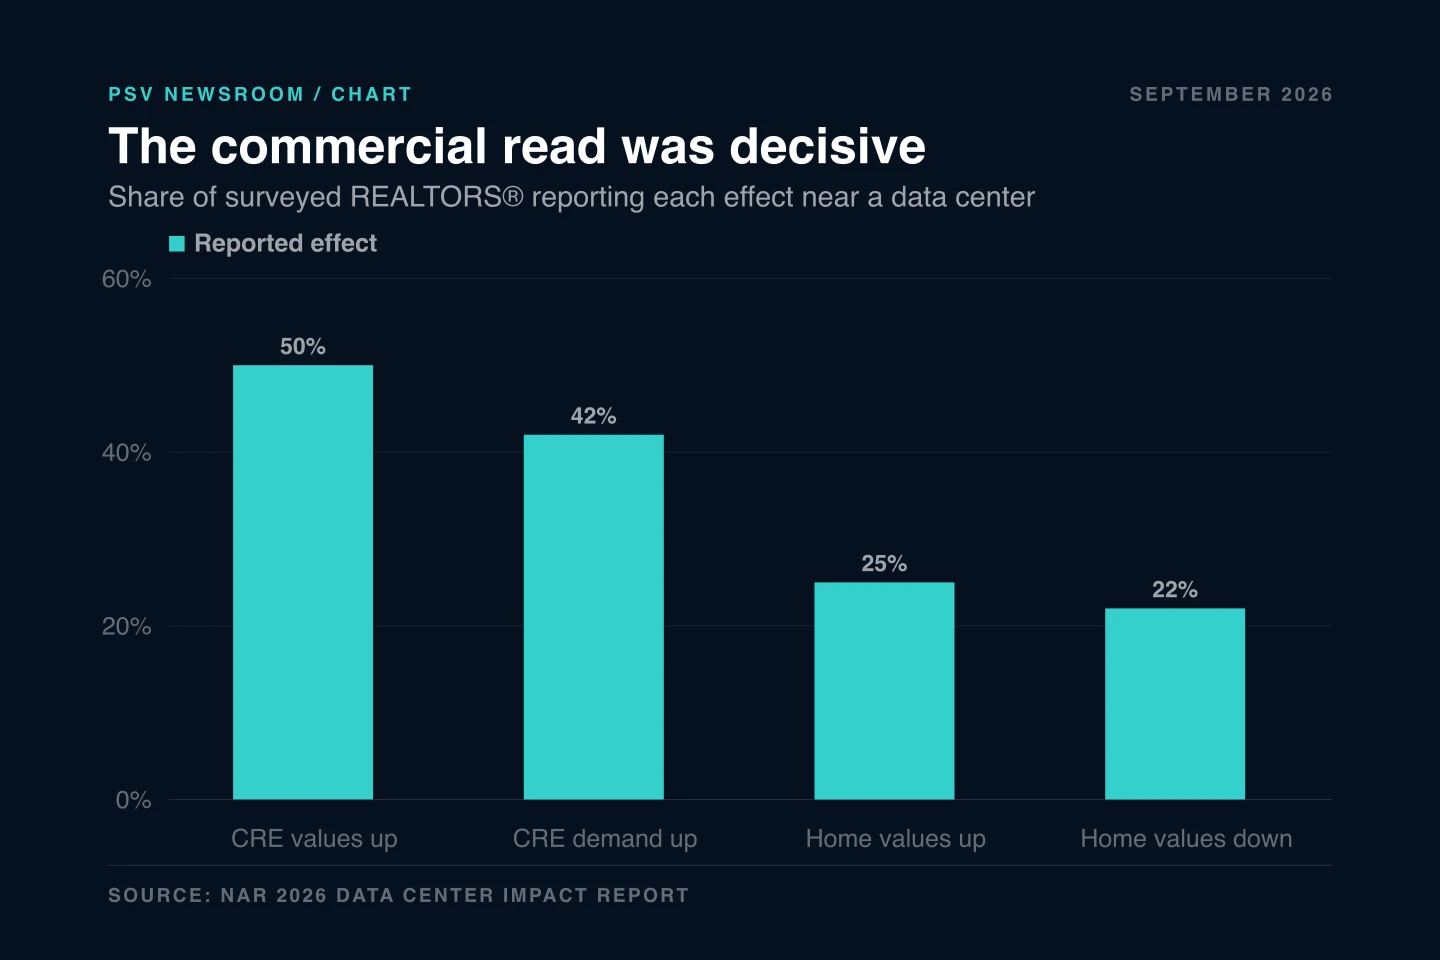
The National Association of REALTORS® published its 2026 Data Center Impact Report on September 8, and the coverage led with housing, where its surveyed agents split 25 percent positive against 22 percent negative on nearby home values. The commercial answers were not close. Fifty percent reported increased nearby commercial property values and 42 percent reported increased demand for nearby commercial space, particularly industrial properties and land.
Direct answer
Direct answer to NAR data center impact report commercial real estate
Only if you hold property in the small number of counties that actually host data centers. NAR’s surveyed agents reported increased nearby commercial values (50 percent) and increased demand for nearby commercial space (42 percent), concentrated in industrial and land. Read it as reported perception, not a price index: NAR maps no data centers in 92 percent of US counties and warns its county figures do not establish causation.
What NAR published, and what its numbers actually say
The National Association of REALTORS® released its 2026 Data Center Impact Report on September 8, 2026, combining national, state and county-level data analysis with a survey of agents who are REALTORS® working in data center markets. The association states the headline finding in the negative: data centers’ impact on real estate is dramatically different depending on the local market. Thirty-eight percent of survey respondents reported a data center already in place or in development in their market. Among them, perceptions of the residential impact were mixed, with 25 percent seeing a positive effect on nearby home values and 22 percent a negative one. The commercial picture was more clearly positive, with 50 percent reporting increased nearby commercial property values and 42 percent reporting increased demand for nearby commercial space, particularly industrial properties and land. Asked what clients actually raise, respondents named energy costs (61 percent) and water use (56 percent). Those are survey responses from agents, which NAR presents as perceptions, not as measured transaction outcomes, and the distinction matters for anyone who wants to use them.
The county analysis is the part that constrains how far any of this travels. NAR maps no data centers in 92 percent of US counties and 10 or more in only 1 percent. The 10 counties with the most facilities hold about 42 percent of them nationwide, and Loudoun County, Virginia alone accounts for about 14 percent; Loudoun and Prince William together account for about 19 percent. NAR names the other major clusters as Silicon Valley (5 percent), central Ohio including Franklin and Licking counties (5 percent), the Phoenix area (4 percent) and central Washington (4 percent). NAR’s own county data file records Loudoun at 213 mapped data center locations in 2026 against 199 in 2025, with 28,218,432 square feet of data center building area and 30,435,065 square feet of campus area; that single-county building figure is larger than many entire suburban office markets, and the year-over-year move computes to about 7 percent growth, PSV’s arithmetic on NAR’s posted file. On the demographic side NAR reports a median home value of $431,750 in counties with 10 or more data centers against $174,500 in counties with none, decade home value growth of 95 percent against 64 percent, median household income of about $89,000 against $64,000, employment growth of about 16 percent from 2014 to 2024 against 2 percent, and residential electricity rates up 21.4 percent from 2020 to 2024 against 15.7 percent elsewhere. NAR cautions directly that correlation is not causation, and that these counties were already high-income, highly educated technology hubs before the recent surge. NAR Chief Economist Lawrence Yun is quoted saying there is no single data center effect and that the number of data centers alone does not tell us what will happen to home values, jobs or utility costs. NAR also states it does not currently have an official policy position on data centers.
The operator read: this is a parcel question wearing a market headline
Almost every outlet led this report with housing, and that is the least decisive thing in it. A 25 to 22 split on nearby home values is close to no signal at all, which is precisely NAR’s point. The commercial answers were the ones that separated: half of surveyed agents in these markets reported higher nearby commercial property values, and 42 percent reported higher demand for nearby commercial space, with industrial property and land called out by name. For a CRE operator that is the useful sentence in the report, and it points at the two product types where a data center cluster plausibly changes the bid: land, because a hyperscaler buying acreage resets what neighbouring ground is worth, and industrial, because the construction and operations tail wants space near the campus. What the report does not supply is a magnitude. It does not report how much values moved, over what period, or on what transactions, because it did not measure transactions; it asked agents what they observed. Treat 50 percent as evidence that the effect is commonly perceived where these facilities exist, not as an input to a pro forma.
The concentration data is the discipline. With 92 percent of counties hosting none and 1 percent hosting 10 or more, there is no national data center trade to put on. The question is always about a specific parcel’s distance to a specific campus, and the answer in Loudoun, where NAR counts 213 locations and 28.2 million square feet of building area, has almost nothing in common with the answer in a county absorbing its first facility. The second half of the operator read is the cost side, and it is the half the value figures obscure. NAR’s residential electricity rate gap, 21.4 percent against 15.7 percent over 2020 to 2024, is a utility-cost divergence in the counties with the heaviest concentration, and energy costs were the top client concern at 61 percent with water use second at 56 percent. For an owner near a cluster those show up in recoveries, in gross-to-net, and in how an entitlement hearing goes, well before they show up in an exit cap. A report that says commercial values are perceived to rise while measured electricity rates rise faster is not a contradiction, it is the whole underwriting problem in one page: the asset may be worth more and cost more to run, and only one of those two is actually measured here.
The workflow PSV would run on data center proximity
The artifact worth building is a proximity file, one row per asset a firm owns or is bidding, refreshed on a schedule rather than assembled during diligence. Inputs: NAR’s posted county data file, which carries per-county facility counts for 2026 and 2025, building square footage, campus square footage and the year-over-year change; the asset’s county and its distance to the nearest mapped campus; the local utility’s filed rate cases and tariff schedules; the county’s permit and rezoning docket for pending facilities; and the lease file, specifically which operating costs are recoverable and which are capped. Output: columns that decide something. The county’s facility count and its one-year change, so a market absorbing its first three facilities is never read through Loudoun’s numbers. Distance bands to the nearest campus and to the nearest announced-but-unbuilt one. The share of the asset’s operating expense exposed to electricity and water, and how much of it is recoverable under the actual leases. The pending-application count, because the entitlement fight is the leading indicator, not the ribbon cutting. And a plain flag for which figures are measured and which are perceived, because this report mixes both and a file that blurs them will mislead whoever reads it next quarter.
The reviewer is the asset manager for held assets and the acquisitions lead for live bids, and the approval gate is narrow: no proximity figure enters an investment memo until someone has named its source and its type, a measured county statistic or a survey perception. An assistant does the volume work well here, and this brief is an example of the shape: pulling a 49-page county table out of a posted PDF, isolating one county’s row, computing a year-over-year change, and reconciling a stated 14 percent share against a raw facility count. It should not be the thing that decides whether proximity to a campus is a premium or a discount for a given asset, because the published record does not answer that and no amount of processing will make it. PSV ran no valuation model on this report, tested no product, and promises no pricing, cost or return outcome. Every figure above is NAR’s except the Loudoun growth rate, which is PSV’s arithmetic on NAR’s file and is stated as such.
What stays with a person, and what is still open
The operator read
Finish with the judgment call.
The reported facts are above. Enter your email for PSV's operator conclusion and a year of access to every newsroom brief.
Free. No card. Privacy policy. Unsubscribe anytime.
 by PSVLive
Build the workflow behind this analysis. Train with the operators doing it.
Real deal files, live builds, and production-ready CRE AI workflows inside the CRE AI Institute.











Clear answers
Common questions about NAR data center impact report commercial real estate
Do data centers increase nearby commercial property values?
In the markets that have them, agents commonly report that they do, but the report behind that finding measures perception rather than transactions. In its 2026 Data Center Impact Report, published September 8, 2026, the National Association of REALTORS® surveyed agents working in data center markets: 50 percent reported increased nearby commercial property values and 42 percent reported increased demand for nearby commercial space, particularly industrial properties and land. The residential answer was far less decisive, splitting 25 percent positive against 22 percent negative on nearby home values. NAR does not publish how much values moved, over what period, or on what transactions, because the survey asked what agents observed rather than measuring sales. NAR also cautions separately that its county-level comparisons do not establish causation: counties with heavy data center concentration were already high-income, highly educated technology hubs before the recent buildout. Treat the 50 percent as evidence the effect is widely perceived where these facilities exist, not as a number to underwrite against.
How concentrated are US data centers by county?
Extremely. NAR maps no data centers in 92 percent of US counties, and only 1 percent of counties have 10 or more. The 10 counties with the most facilities hold about 42 percent of them nationwide. Loudoun County, Virginia alone accounts for about 14 percent, and Loudoun and Prince William counties together account for about 19 percent. NAR names the other major clusters as Silicon Valley at 5 percent, central Ohio including Franklin and Licking counties at 5 percent, the Phoenix area at 4 percent, and central Washington at 4 percent. NAR’s posted county data file records Loudoun at 213 mapped data center locations in 2026 against 199 in 2025, with 28,218,432 square feet of data center building area and 30,435,065 square feet of campus area. The practical consequence for an operator is that there is no national data center trade to put on. Proximity is a parcel-level question about distance to a specific campus, and a county absorbing its first facility has little in common with Loudoun.
What do data centers do to energy and water costs nearby?
NAR’s report gives one measured figure and one reported concern, and they should not be confused. The measured figure: residential electricity rates rose 21.4 percent from 2020 to 2024 in counties with 10 or more data centers, against 15.7 percent in counties with none. The reported concern: asked what their clients actually raise about nearby data centers, surveyed agents named energy costs first at 61 percent and water use second at 56 percent. For a commercial owner near a cluster, this is the half of the story the value figures obscure. Utility cost divergence shows up in recoveries, in gross-to-net, and in how an entitlement hearing goes, well before it shows up in an exit cap. Note the timing limit: NAR’s electricity data runs through 2024 while its facility counts run through 2026, so the rate figures do not yet reflect the most recent wave of construction.
Primary source record
These records support the reported facts in this brief. PSV’s CRE workflow interpretation and test plan are original analysis.
- National Association of REALTORS®, “There’s No Single ‘Data Center Effect’ on Housing Markets, NAR Report Finds,” September 8, 2026 (source of every survey percentage, the county demographic comparisons, the concentration shares and the Lawrence Yun quotes)
- National Association of REALTORS®, 2026 Data Center Impact Report (report landing page and data files)
- National Association of REALTORS®, Data Center Impact and Concentration data by county, posted September 2026 (source of Loudoun County’s 213 locations in 2026, 199 in 2025, 28,218,432 square feet of building area and 30,435,065 square feet of campus area)
- National Association of REALTORS®, Data Center Impact and Demographic Data by County, posted September 2026
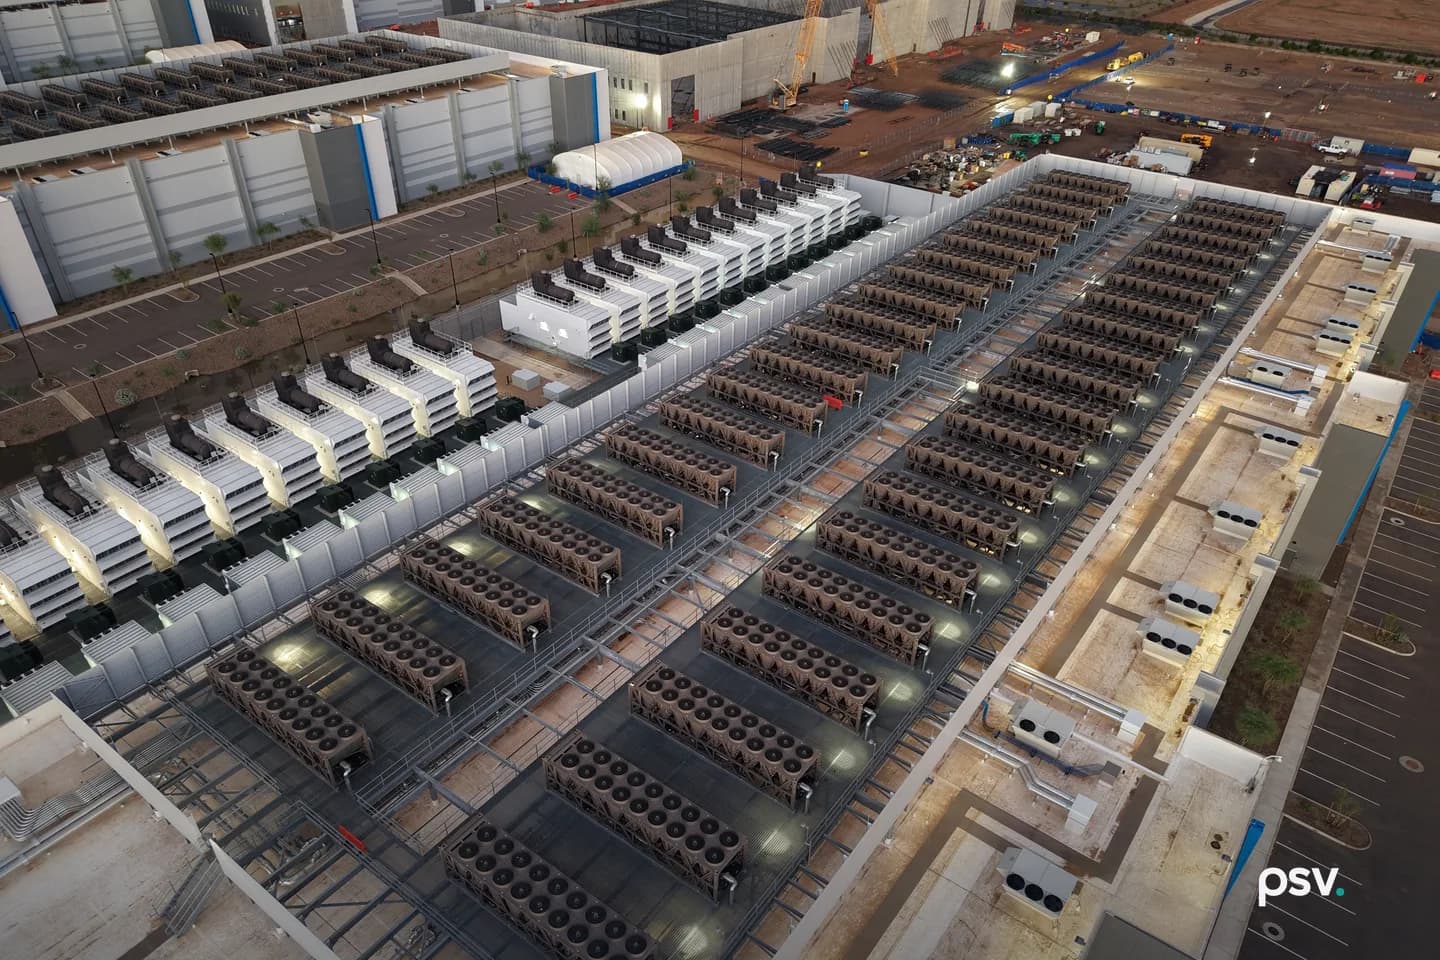
- Rsparks3, “Data center roof,” Wikimedia Commons, CC0 (lead photograph source)
Topics
Related PSV analysis
CRE POLICY NEWS
Six Federal Cases Are Testing Where a Data Center Can Sit
Five federal class actions filed since April accuse data center operators of pushing unreasonable noise onto neighboring homes, and a sixth case runs the other direction: a developer suing Nashville over a permit moratorium. PSV read all six dockets. Two of the five have already ended, neither of them on the merits, and the pattern is not the one the trade press is describing.
CRE CAPITAL NEWS
CBRE’s Infrastructure Line Outgrew Leasing: The CRE Read
CBRE reported second quarter revenue of $11.2 billion on July 29, up 15.5 percent, and raised its 2026 core EPS outlook to $7.80 to $7.90. Buried in the segment detail is the number that matters to operators: revenue from critical infrastructure services reached $676 million, up from $403 million a year earlier, and that one line added more new revenue in the quarter than global leasing did.
CRE AI NEWS
Manhattan’s Office Squeeze Is Measured. Its AI Story Is Not.
Colliers reported on September 1 that Manhattan office availability fell to 65.40 million square feet in August, the lowest since September 2020, with the availability rate at 12.5 percent and sublet supply at its lowest since 2019. Year to date leasing of 29.91 million square feet puts 2026 on pace for the strongest year since 2000. Colliers does not attribute any of it to AI.
Related guides
Cornerstone PSV guides on the workflows in this article.
AI Agents for Commercial Real Estate
What an AI agent is in CRE terms, the layers of a working agent, and the case for owning your agent rather than renting a black box.
Read the guideClaude for Real Estate Developers
The ground-up developer field guide: site selection through IC memo, built on a real development deal.
Read the guideIndustrial & Logistics AI Underwriting
Custom AI employees for industrial real estate underwriting. WALT analysis, tenant credit, clear-height and power modeling, and lender packages.
Read the guideby PSVLiveYou read the operator view. Now learn to run the workflow.
The AI MBA for commercial real estate: the workflows these briefs describe, taught end to end on real deal files, with live builds and a community of CRE operators.