CRE AI NEWS
Brookings Paper Puts the AI Build-Out at $10.3 Trillion
A Brookings Papers on Economic Activity conference draft by Columbia real estate professor Stijn Van Nieuwerburgh, posted September 23 for presentation September 25, projects $10.3 trillion of U.S. AI infrastructure investment from 2025 to 2032, about 3.63 percent of GDP a year, and warns that the financing is moving into leases, joint ventures and special-purpose vehicles that are hard to see.
Direct answer
Direct answer to Financing the AI Buildout Brookings
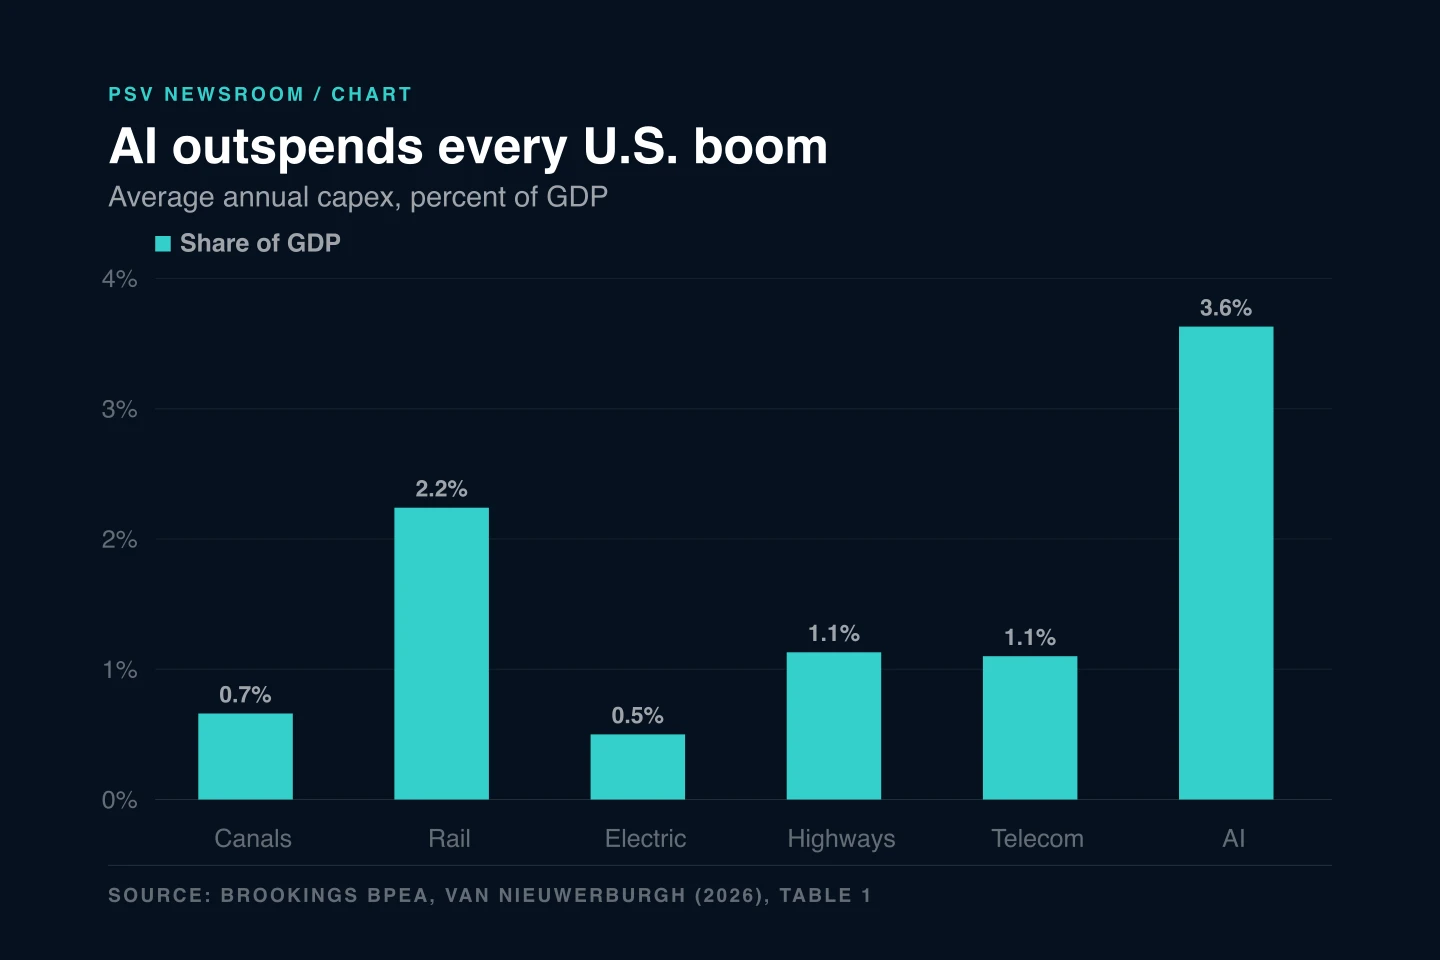
The headline is scale: $10.3 trillion over 2025 to 2032, larger relative to GDP than the railroad, highway or telecom booms. The CRE story is structure. The paper documents data center shells and power moving off hyperscaler balance sheets into leased, highly leveraged project vehicles, with tenant concentration, obsolescence and residual value risk sitting with landlords and lenders. It says systemic risk is not yet established.
What Brookings published, and what the paper estimates
Brookings posted “Financing the AI buildout” on September 23, 2026, a summary and conference draft of a paper by Stijn Van Nieuwerburgh, the Earl Kazis and Benjamin Schore Professor of Real Estate at Columbia Business School. It is one of three papers on the Panel on AI and Policy at the fall 2026 Brookings Papers on Economic Activity conference, scheduled for 9:00 a.m. Eastern on Friday, September 25. The draft itself is dated September 4, 2026 and carries the standard Brookings notice that each publication represents the sole views of its author. Its central estimate is that investment in data center buildings, power systems, networking and specialized chips will total $10.3 trillion from 2025 to 2032, an average of 3.63 percent of U.S. GDP a year. The paper’s Table 1 sets that against earlier booms as average annual capital expenditure over each period: canals at 0.66 percent of GDP from 1836 to 1841, railroads at 2.24 percent from 1870 to 1890, electrification at 0.50 percent from 1905 to 1925, highways at 1.13 percent from 1956 to 1973, and telecom and fiber at 1.10 percent from 1996 to 2003. The AI figure is a projection; the others are history.
The estimate is built bottom up, and the method is the part an operator can check. Using Cleanview project-level data from July 2026, the paper counts about 57 GW of operating U.S. data center capacity and a planned pipeline of about 509 GW, which it says plainly is not a completion forecast. Its central scenario completes 182.8 GW during 2025 to 2032, including 19.0 GW tied to projects already operating in 2025 or 2026, completes a further 117.2 GW after 2032, and never builds 226.9 GW. Setting aside the 19.0 GW already operating, the remaining three buckets sum to 507.9 GW, which computes to the paper’s approximate 509 GW pipeline. Costs come from a representative 200 MW AI training campus at roughly $8.2 billion: about $2.2 billion for the facility, $0.4 billion for incremental power infrastructure and $5.6 billion for the installed IT system, with GPU racks at $4 million each. The abstract scales that to about $41 billion per GW. On financing capacity, the paper reports that capital expenditures at Oracle, Microsoft, Amazon, Meta and Alphabet rose from about $97 billion in 2020 to more than $400 billion in 2025 and are projected to exceed $800 billion in 2026, above their combined operating cash flow for the first time. Its figure puts 2026 at $800.5 billion of capex against $707.1 billion of operating cash flow, which computes to about 113 percent.
Why a CRE operator should read past the headline
The trillion-dollar total is mostly chips. By the paper’s own breakdown, the facility and power infrastructure are about one-third of a campus’s initial cost and the compute hardware about two-thirds, and hyperscalers tend to point their own capital at the IT equipment. The buildings, shells and power are the layer being moved to third parties. The paper describes developers, REITs, infrastructure funds and private equity building or buying facilities and leasing capacity to hyperscalers, financed by bank mortgages, syndicated lines, private credit and securitization, and it says data centers have become a major institutional real estate asset class. That is the CRE exposure, and the paper’s worked example is Meta’s Hyperion financing in Louisiana. For the financed phase of roughly 2.0 GW and about $30 billion, the paper says Meta sold an 80 percent equity stake to Blue Owl for about $2.5 billion, and the joint venture, Beignet, raised $27 billion of debt in October 2025, rated A+ by S&P, one notch below Meta. The paper puts debt to assets near 90 percent, the debt service coverage ratio at 1.12x, and the yield at 6.58 percent, at least 100 basis points over what it estimates Meta would have paid unsecured, or more than $5 billion of extra interest over the financing’s life.
The lease terms are where a landlord’s underwriting changes. According to the paper, Meta holds a sequence of five four-year leases beginning in 2029 and running to the bonds’ 2049 maturity, may terminate some or all of the campus at each renewal, and in that case must cover any shortfall between sale proceeds and a contractually specified minimum value. Under current GAAP, the paper says, neither the future leases nor that residual value guarantee sits on Meta’s balance sheet before it takes effect, even though one of the two will. It cites Moody’s estimate of roughly $970 billion of hyperscaler lease commitments, about $660 billion of them for leases not yet on balance sheet, and says Meta and BlackRock’s 960 MW Sopaipilla project in El Paso, Texas used a nearly identical structure for $12.3 billion of A+ bonds in July 2026. It adds two market signals. The 36-month rolling beta of data center REITs, measured on FTSE Nareit index returns, has risen from roughly 0.5 to around 1, which the author reads as data centers behaving less like defensive infrastructure and more like part of the same risk complex as AI stocks. And under its central assumptions, the 2025 to 2032 buildout needs about $3.7 trillion of annual revenue by 2032 to earn a 10 percent unlevered return at a 50 percent operating margin, roughly $6.9 per billed GPU-hour at 80 percent utilization.
The workflow PSV would run on a data center exposure
The artifact worth building is an exposure register for any data center an owner holds, lends against or is bidding, one row per asset, assembled from documents rather than marketing. Inputs: the lease and every amendment; any residual value, construction or completion guarantee; the ownership chart down to the special-purpose entities; a rating agency pre-sale report where the debt is rated; the tenant’s most recent 10-K and 10-Q lease commitment footnotes; and the interconnection and power agreements. Output: columns that answer the paper’s questions for one building. Who legally owns the asset, and who bears demand, refinancing and residual value risk, which the paper argues are no longer the same party. The tenant’s termination and renewal dates. The guaranteed minimum value and who stands behind it. Debt to value and debt service coverage at the property level, not the tenant’s corporate leverage. The share of rent from one tenant. And a line for what is not disclosed, because the paper notes that publicly rated debt is a small share of data center financing and that syndicated bank loans and private credit, which are much larger, publish little. Every populated cell cites a page of a contract or a filing.
The reviewer is the acquisitions or credit lead, with counsel on the guarantee and termination language, and the approval gate is specific: no valuation, loan sizing or exit cap assumption treats a terminable lease with a residual value guarantee as equivalent to a fixed 20-year term until someone has modeled the renewal dates and read who pays the shortfall. An assistant is useful for the volume here, pulling lease commitment tables out of five hyperscalers’ filings, extracting renewal and termination clauses from a lease stack, and flagging where an entity chart has an unexplained layer. It should not decide the probability of a renewal, value a stranded 200 MW shell, or convert the paper’s national scenario into a view on one market. PSV ran no model on this paper, tested no product, and promises no underwriting, valuation or return outcome.
What stays with a person, and what the paper does not settle
The operator read
Finish with the judgment call.
The reported facts are above. Enter your email for PSV's operator conclusion and a year of access to every newsroom brief.
Free. No card. Privacy policy. Unsubscribe anytime.
 by PSVLive
Build the workflow behind this analysis. Train with the operators doing it.
Real deal files, live builds, and production-ready CRE AI workflows inside the CRE AI Institute.











Clear answers
Common questions about Financing the AI Buildout Brookings
How much will the AI build-out cost, according to Brookings?
A Brookings Papers on Economic Activity conference draft by Columbia’s Stijn Van Nieuwerburgh, posted September 23, 2026, projects $10.3 trillion of U.S. investment in data center buildings, power systems, networking and specialized chips from 2025 to 2032, an average of 3.63 percent of GDP a year. The paper compares that with railroads at 2.24 percent of GDP from 1870 to 1890, highways at 1.13 percent from 1956 to 1973 and telecom and fiber at 1.10 percent from 1996 to 2003. The AI figure is a scenario-based projection, not a forecast.
How much of an AI data center’s cost is real estate?
In the paper’s cost model, a representative 200 MW AI training campus costs roughly $8.2 billion: about $2.2 billion for the data center facility, $0.4 billion for incremental power infrastructure and $5.6 billion for the installed IT system. That makes the facility and power about one-third of the initial cost and the compute hardware about two-thirds. The paper says hyperscalers tend to fund the IT equipment themselves while shells, power and related real estate move to project debt, leases and third-party owners.
Why does the paper worry about off-balance-sheet data center financing?
Because leverage and contingent obligations become harder to see. The paper’s example is Meta’s Hyperion financing, where the Beignet joint venture raised $27 billion of debt against about $30 billion of assets, roughly 90 percent debt to assets at a 1.12x debt service coverage ratio, backed by terminable four-year leases and a residual value guarantee that do not appear on Meta’s balance sheet before they take effect. The author says it is premature to call this systemic risk and recommends better measurement and disclosure.
Primary source record
These records support the reported facts in this brief. PSV’s CRE workflow interpretation and test plan are original analysis.
- Brookings Institution, “Financing the AI buildout,” BPEA Fall 2026 summary page, September 23, 2026 (source of the $10.3 trillion and 3.63 percent of GDP estimate, the shift to off-balance-sheet financing, and the author’s quoted conclusions on systemic risk and transparency)
- Stijn Van Nieuwerburgh, “Financing the AI Buildout,” Brookings Papers on Economic Activity conference draft, draft dated September 4, 2026 (source of Table 1, the 200 MW campus cost breakdown, the 57 GW, 509 GW, 182.8 GW, 117.2 GW and 226.9 GW capacity figures, hyperscaler capex and operating cash flow, the Hyperion and Beignet financing terms, the Moody’s lease figures, the data center REIT beta, and the $3.7 trillion revenue requirement)
- Brookings Institution, BPEA Fall 2026 conference agenda (source of the September 25, 2026 Panel on AI and Policy presentation)
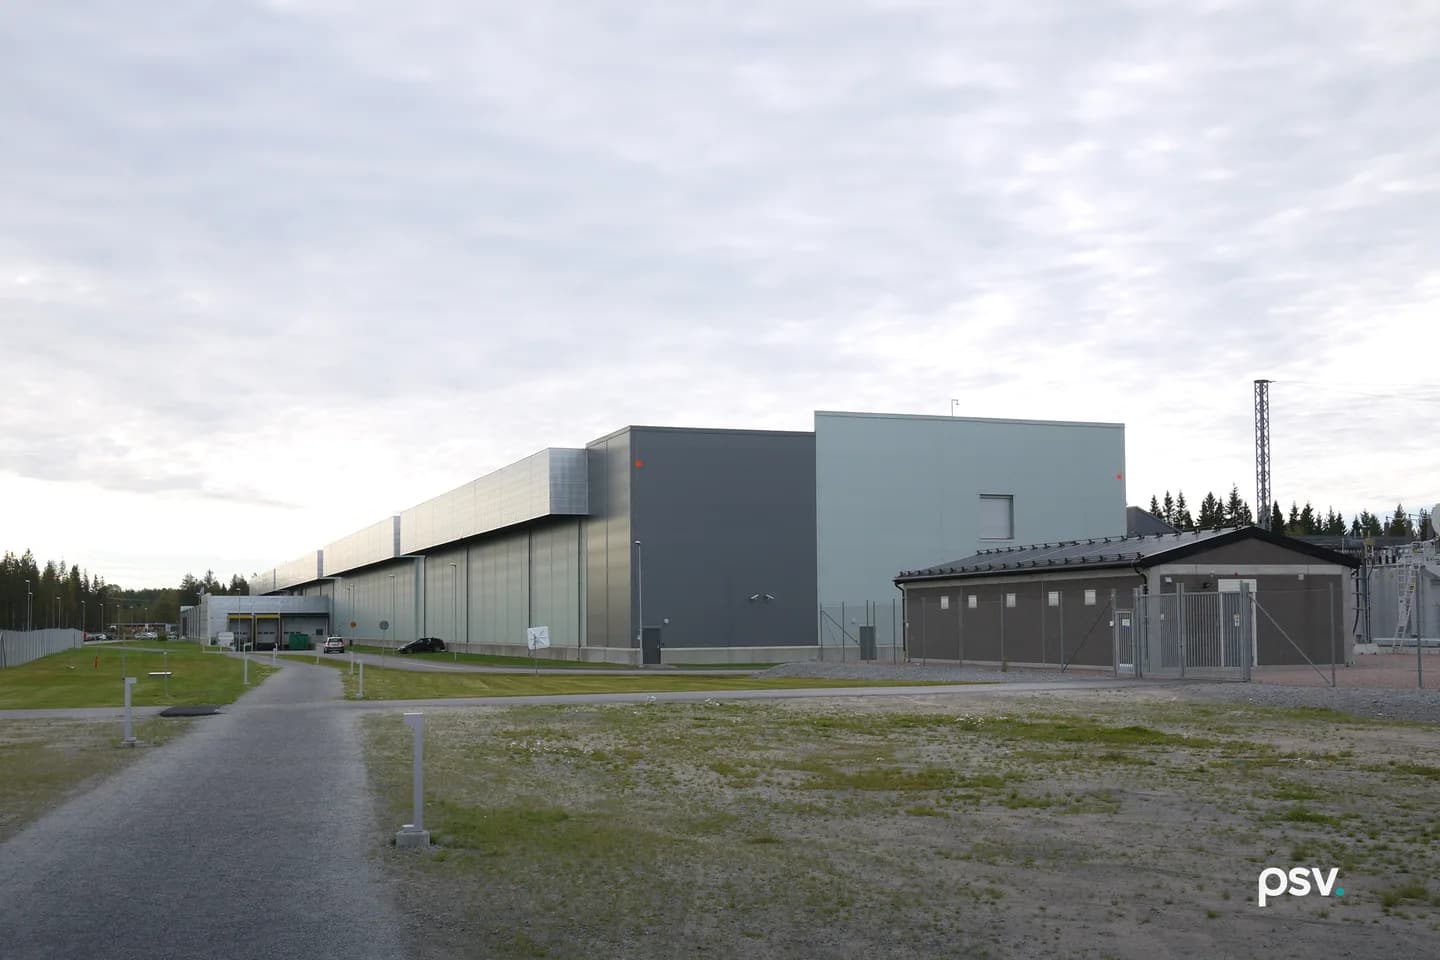
- Christopher Down, Luleå Facebook datacenter building, Wikimedia Commons, CC BY 4.0 (lead photograph source)
Topics
Related PSV analysis
CRE AI NEWS
Meta’s $50B Hyperion Expansion: The CRE Read on a 5 GW Campus
Meta says its Richland Parish campus will reach about 10 million square feet and 5 gigawatts, with more than $50 billion committed. The durable CRE signal is what a commitment this size does to land, power, housing, and industrial demand around it, and which documents actually move value.
CRE AI NEWS
Amodei’s “Pace the Frontier” and Data Center REITs
On September 12, 2026 Anthropic chief executive Dario Amodei published “We Must Pace the Frontier,” an essay calling on AI companies to slow the rate at which model capabilities improve. Data center landlords sold off in the next session: Digital Realty fell 5.0 percent and Equinix 3.8 percent on September 14. By September 18 both had recovered part of the drop.
CRE POLICY NEWS
Data Center Watch Q2 2026: $68B of Projects Disrupted
Data Center Watch, a research project of 10a Labs that tracks local opposition to data center development, says at least 45 U.S. projects worth nearly $68 billion were blocked or delayed by local opposition from April through June 2026. That is below its Q1 count of 75 projects and about $130 billion, but the first half of 2026 now exceeds its full-year 2025 total.
Related guides
Cornerstone PSV guides on the workflows in this article.
Claude Engineering Partner for CRE
What it means to run Claude with an engineering partner: the operating model, the controls, and who owns what.
Read the guideEnterprise AI for Institutional CRE
PSV trains your whole firm on Claude and ChatGPT, builds your agents live inside your own environment, and stays on as your embedded AI team. What we build for you is yours.
Read the guideAI Engineering for CRE
PSV builds custom AI employees for commercial real estate. Every number cites its source document, and the citation holds from deal to IC memo.
Read the guideby PSVLiveYou read the operator view. Now learn to run the workflow.
The AI MBA for commercial real estate: the workflows these briefs describe, taught end to end on real deal files, with live builds and a community of CRE operators.